Electrocardiography (ECG) is a diagnostic tool used to measure the electrical activity of the heart. As per Oxford Medical Education, an ECG machine records the electrical signals from the heart and produces an ECG waveform, which is a graphical representation of the heart’s electrical activity. Interpreting ECG values is an essential skill for healthcare professionals, as it allows them to identify potential heart problems and provide the appropriate treatment. In this article, we will discuss how to interpret ECG values.
ECG Waveform
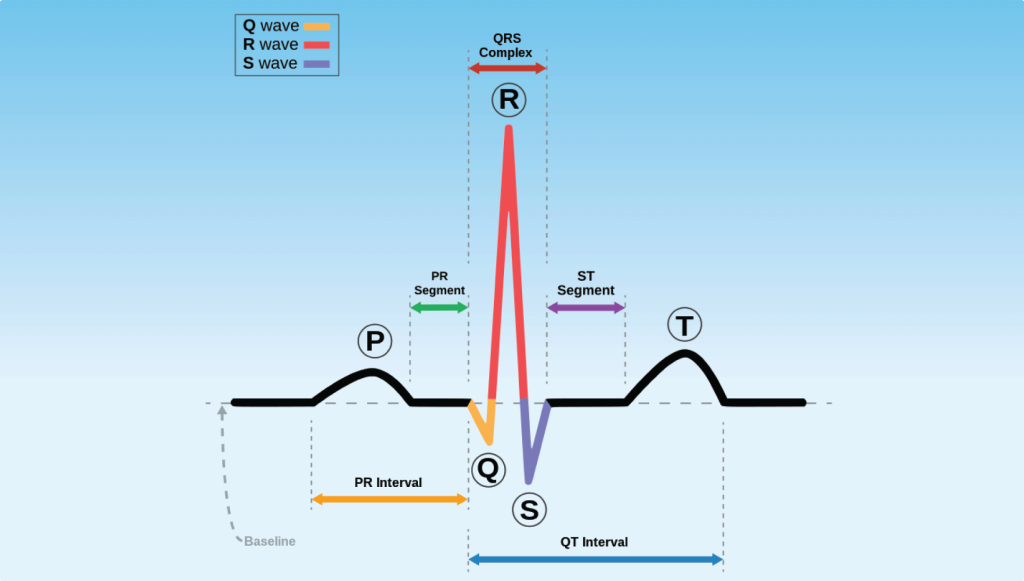
Before discussing how to interpret ECG values, it’s important to understand the ECG waveform. The ECG waveform has several components:
- P wave – The P wave represents the electrical activity that occurs when the atria (the top chambers of the heart) contract to pump blood into the ventricles (the bottom chambers of the heart).
- QRS complex – The QRS complex represents the electrical activity that occurs when the ventricles contract to pump blood out of the heart.
- T wave – The T wave represents the electrical activity that occurs when the ventricles are repolarizing (returning to their resting state) after contraction.
- U wave – The U wave is a small waveform that sometimes appears after the T wave. Its significance is not well understood, but it is thought to represent repolarization of the Purkinje fibers, which are specialized cells in the ventricles.
Interpreting ECG Values
To interpret ECG values, healthcare professionals must analyze several different aspects of the ECG waveform:
- Heart rate – The heart rate can be determined by calculating the number of QRS complexes per minute. A normal heart rate is between 60 and 100 beats per minute.
- Rhythm – The rhythm of the heartbeat can be determined by analyzing the spacing between each QRS complex. A regular rhythm has consistent spacing between QRS complexes, while an irregular rhythm has inconsistent spacing.
- P wave – The P wave should be upright and of normal shape. If the P wave is absent or abnormal, it may indicate atrial fibrillation, atrial flutter, or other atrial arrhythmias.
- PR interval – The PR interval is the time it takes for the electrical signal to travel from the atria to the ventricles. A normal PR interval is between 0.12 and 0.20 seconds. If the PR interval is longer than 0.20 seconds, it may indicate an atrioventricular block.
- QRS complex – The QRS complex should be narrow and of normal shape. If the QRS complex is wider than 0.12 seconds, it may indicate a ventricular arrhythmia or bundle branch block.
- ST segment – The ST segment should be flat and at the same level as the baseline. If the ST segment is elevated or depressed, it may indicate myocardial ischemia, injury, or infarction.
- T wave – The T wave should be upright and of normal shape. If the T wave is inverted, it may indicate myocardial ischemia, injury, or infarction.
ECG Interpretation Examples
Let’s look at some examples of ECG waveforms and how to interpret them:
- Normal Sinus Rhythm
The ECG waveform shows a regular rhythm with a heart rate of 72 beats per minute. The P wave, PR interval, QRS complex, ST segment, and T wave are all within normal limits.
The ECG waveform shows an irregular rhythm with no discernible P waves. The QRS complex, ST segment, and T wave are all within normal limits.
- Atrial Flutter
The ECG waveform shows a regular rhythm with a sawtooth.
In conclusion, interpreting ECG values is a crucial skill for healthcare professionals to identify potential heart problems and provide appropriate treatment. As per Geeky Medics, understanding the different components of the ECG waveform, such as the P wave, QRS complex, ST segment, and T wave, is essential in determining heart rate, rhythm, and potential abnormalities.
By carefully analyzing these ECG values, healthcare professionals can make accurate diagnoses and develop effective treatment plans for patients with heart conditions. Misinterpretation of ECG values can lead to misdiagnosis and potentially harmful consequences for patients. Therefore, proper training and ongoing education are essential for healthcare professionals to develop and maintain proficiency in ECG interpretation.